---
title: "Example 03: Experimenting with geoms"
---
```{r}
library(tidyverse)
library(gapminder)
library(palmerpenguins)
```
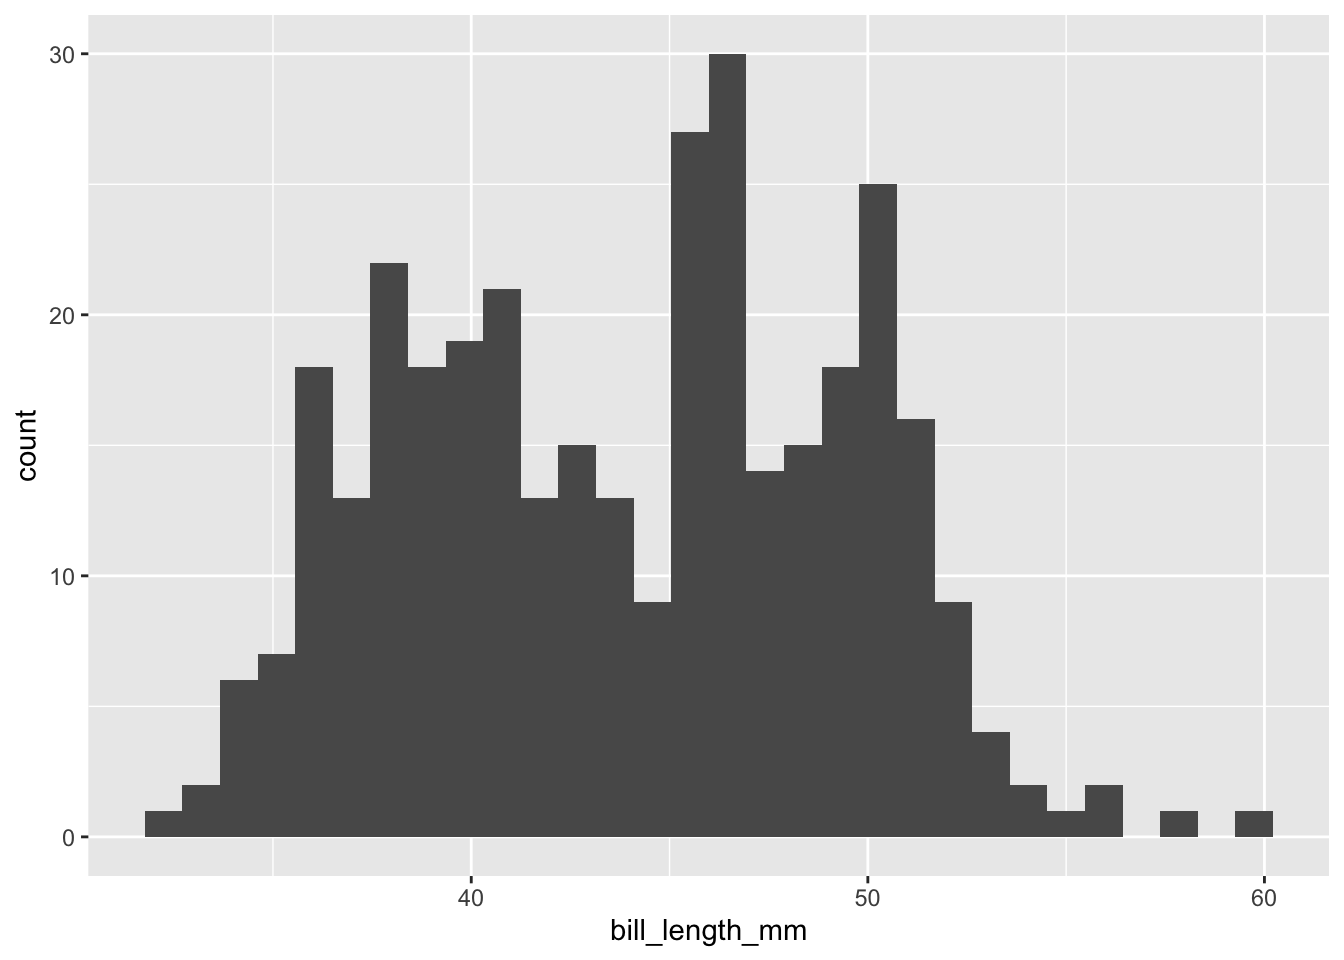
# Penguin histograms
```{r}
penguins |>
  ggplot(mapping = aes(bill_length_mm)) +
  geom_histogram()
```
```{r}
penguins |>
  drop_na(bill_length_mm) |>
  ggplot(mapping = aes(x = bill_length_mm)) +
  geom_histogram()
```
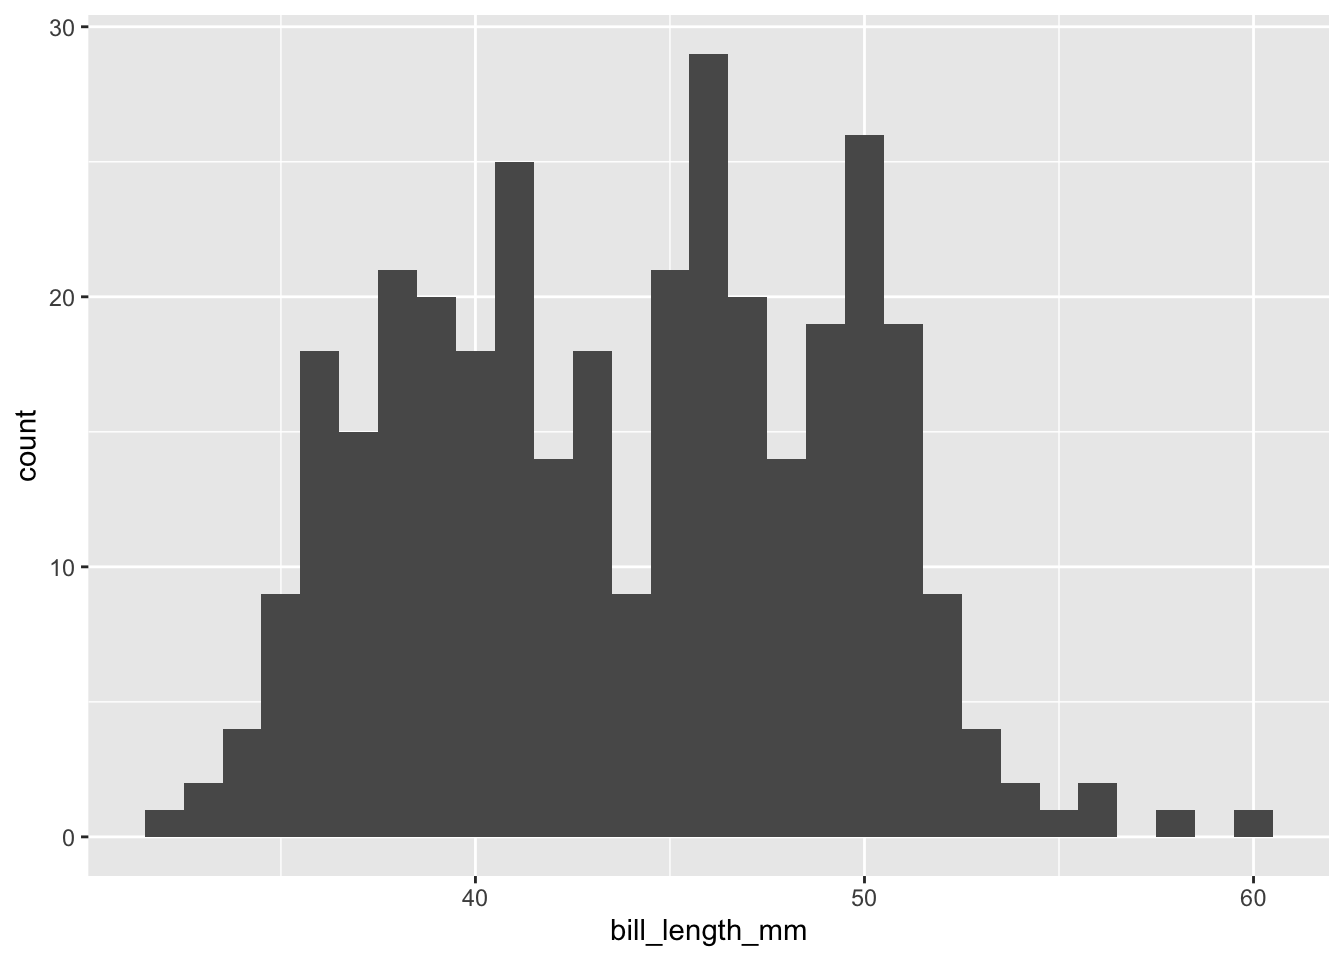
```{r}
penguins |>
  drop_na(bill_length_mm) |>
  ggplot(mapping = aes(x = bill_length_mm)) +
  geom_histogram(binwidth = 1)
```
```{r}
penguins |>
  drop_na(bill_length_mm) |>
  ggplot(mapping = aes(x = bill_length_mm)) +
  geom_histogram(binwidth = 1)
```
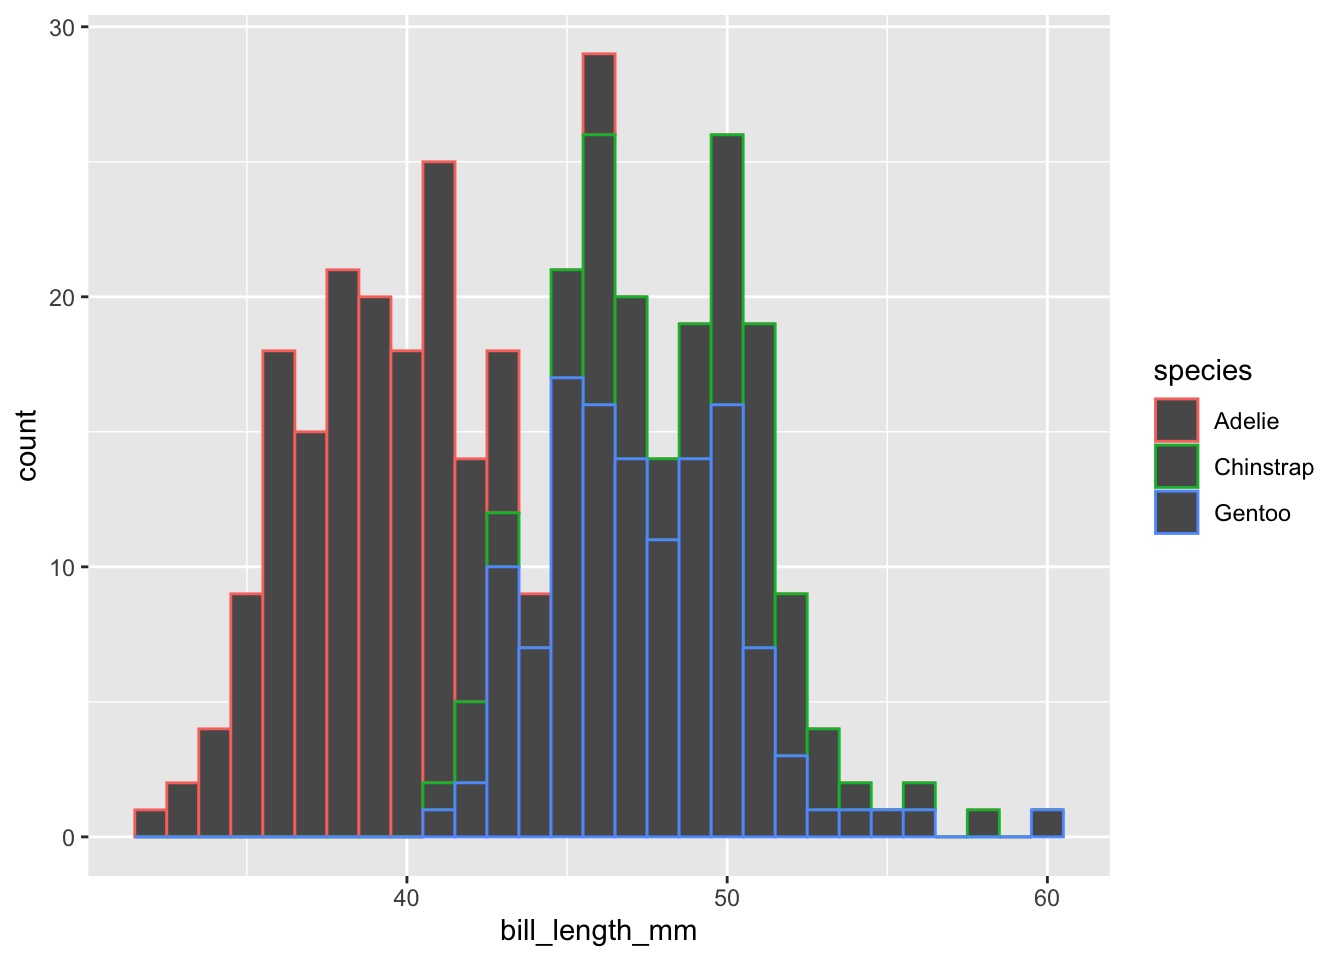
```{r}
penguins |>
  drop_na(bill_length_mm) |>
  ggplot(mapping = aes(x = bill_length_mm,
                       color = species)) +
  geom_histogram(binwidth = 1)
```
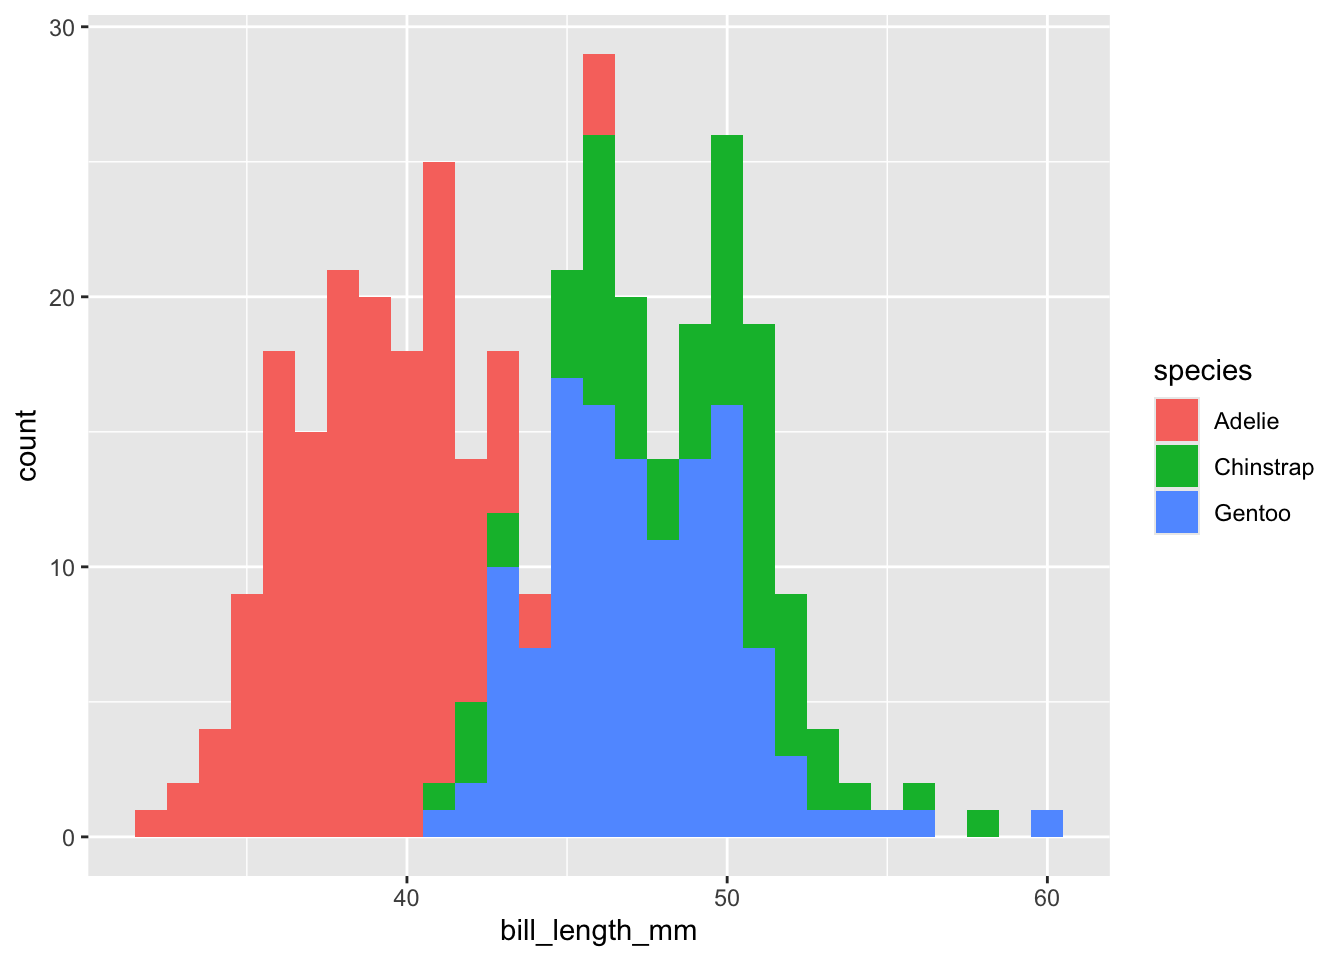
```{r}
penguins |>
  drop_na(bill_length_mm) |>
  ggplot(mapping = aes(x = bill_length_mm,
                       fill = species)) +
  geom_histogram(binwidth = 1)
```
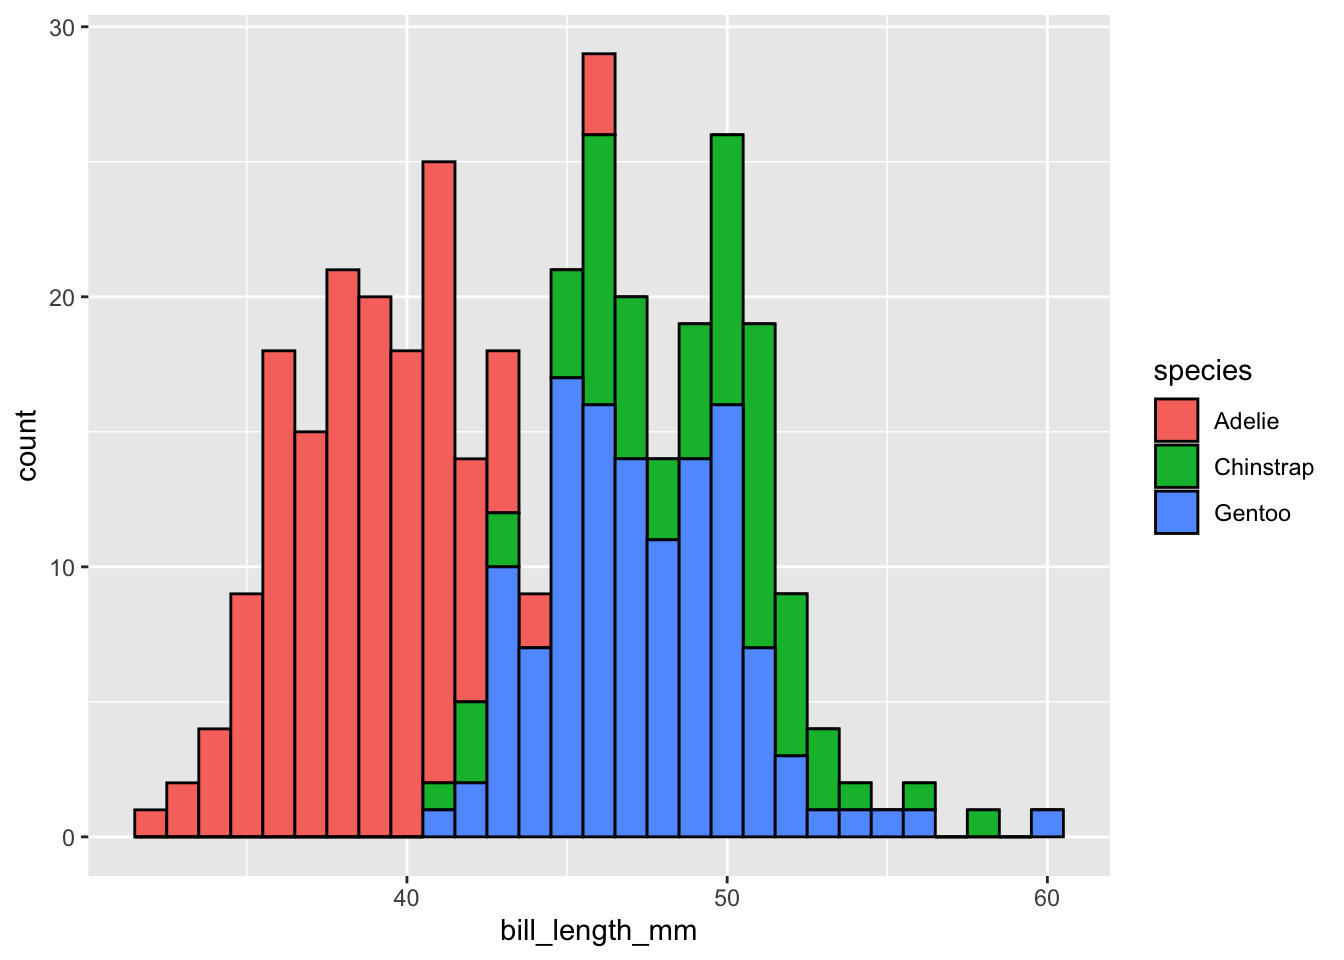
```{r}
penguins |>
  drop_na(bill_length_mm) |>
  ggplot(mapping = aes(x = bill_length_mm,
                       fill = species)) +
  geom_histogram(binwidth = 1, color = "black")
```
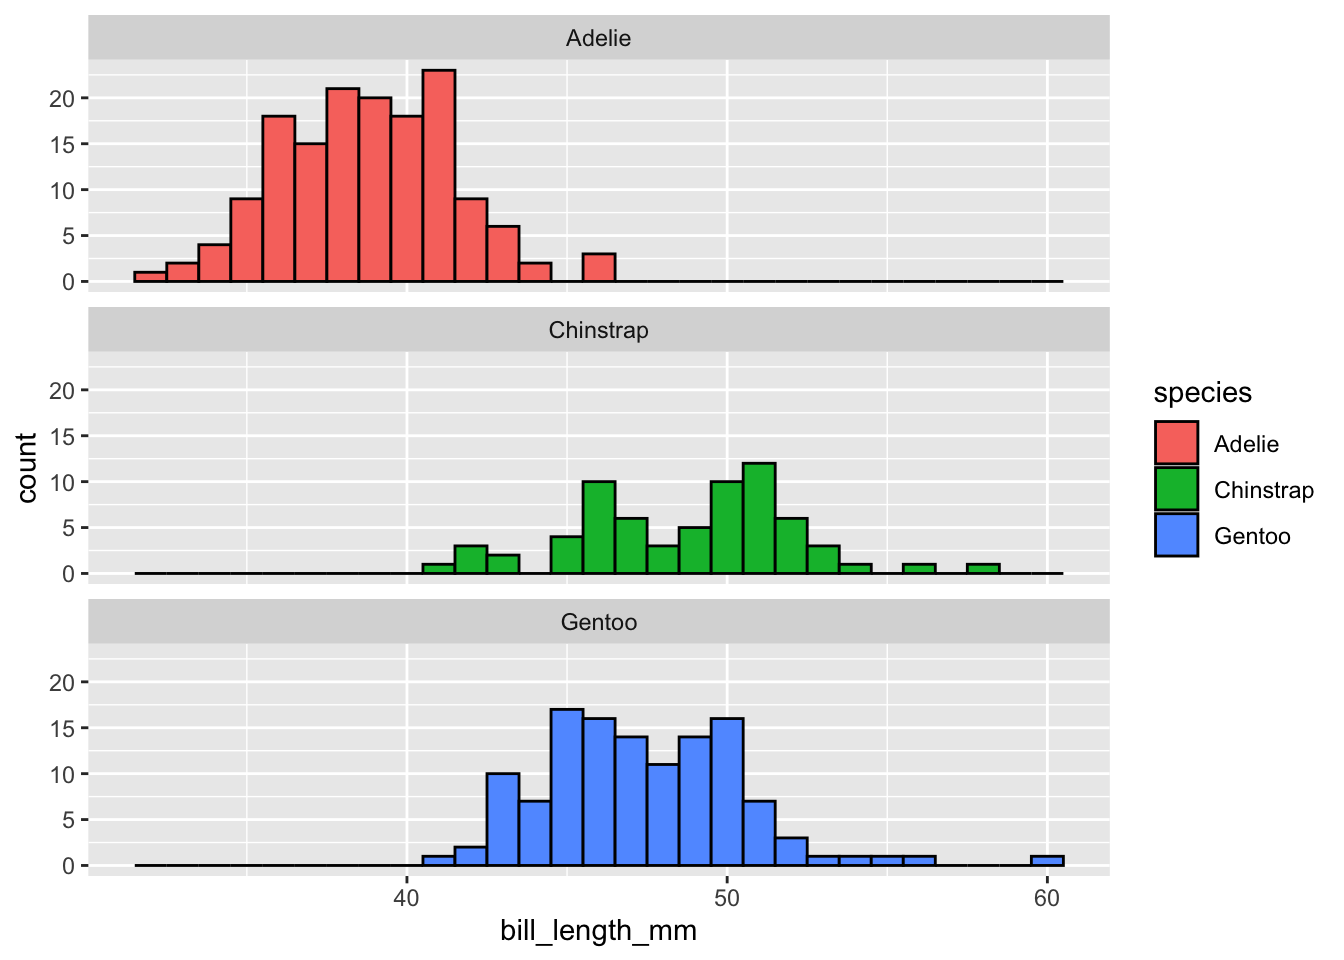
```{r}
penguins |>
  drop_na(bill_length_mm) |>
  ggplot(mapping = aes(x = bill_length_mm,
                       fill = species)) +
  geom_histogram(binwidth = 1, color = "black") +
  facet_wrap(~ species, ncol = 1)
```
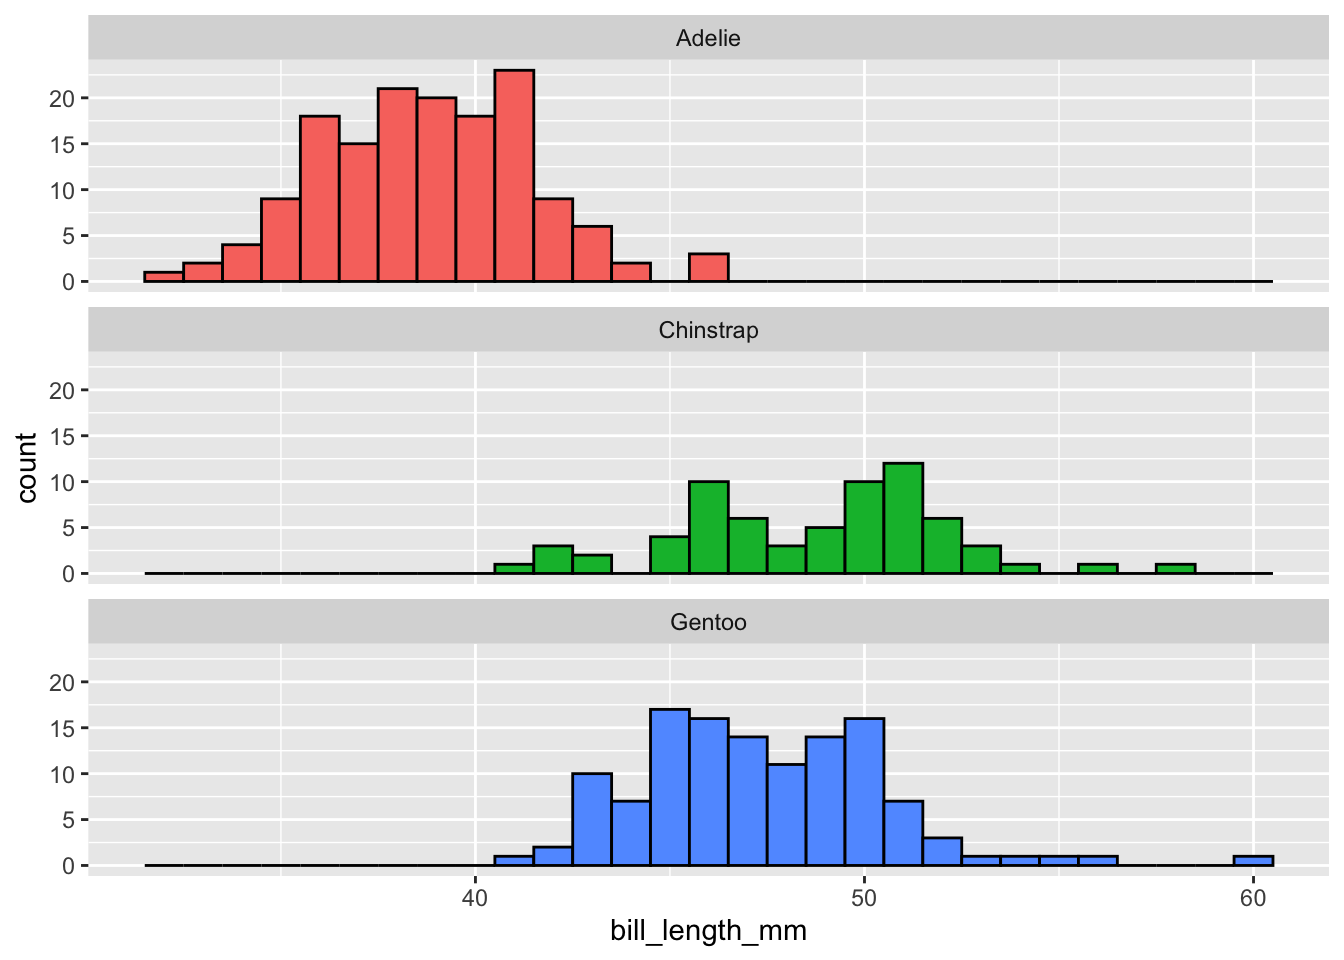
```{r}
penguins |>
  drop_na(bill_length_mm) |>
  ggplot(mapping = aes(x = bill_length_mm,
                       fill = species)) +
  geom_histogram(binwidth = 1, color = "black") +
  facet_wrap(~ species, ncol = 1) +
  guides(fill = "none")
```
```{r}
penguins |>
  drop_na(bill_length_mm) |>
  ggplot(mapping = aes(x = bill_length_mm,
                       fill = species)) +
  geom_histogram(binwidth = 1, color = "black") +
  facet_wrap(~ species, ncol = 1) +
  guides(fill = "none") +
  labs(x = "Bill Length (mm)",
       y = "Count")
```